1. Introduction#
Introduction to PyAOS#
PyAOS (Python for Atmosphere and Ocean Science) is a suite of Python libraries. According to the definitions on PyAOS official website, PyAOS is
Python libraries stack used by the AOS community. A group of programs that works in tandem to produce a result or achieve a common goal is often referred to as a software stack.
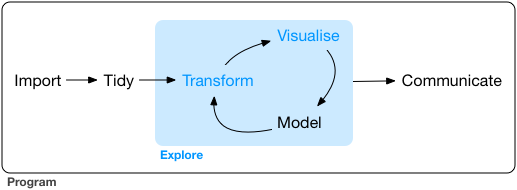
In studies in the fields of atmospheric sciences, the most commonly used workflow is as follows:
reading datasets,
and/or numerical modeling,
statistical analysis,
visualization.

Source: Grolemund and Wickham (2016), R For Data Science.
How can PyAOS packages help us to complete these tasks? First of all, we learn about the “core libraries” of PyAOS. In the figure below, the Python libraries in the dashed rectangle are the core libraries. The default package for simple arithmetic or statistical computation is Numpy. The package that deals with more complicated scientific or mathematical computation, such as calculus, is Scipy. For large dataset computation that needs parallel computation, it is common practice to use Dask. Dask, Numpy, and Scipy are well-integrated. After computation, the well-known package for visualization is Matplotlib. For meteorologists who often plot geographical maps, Cartopy is utilized to set the projection of maps.
Although the aforementioned packages are sufficient to complete our research, they are not best suited for atmospheric needs. Specifically, the fundamental functions in these libraries often require longer codes. To simplify the workflow and make coding more efficient, the PyAOS community developed advanced libraries for atmospheric science studies. These libraries include xarray and iris. In this workshop, we will focus on the usages and applications of xarray.
Introduction to Xarray#
xarray was developed by Stephan Hoyer, Alex Kleeman, and Eugene Brevdo from The Climate Corporation. It was first released as an open-source project in 2014. From 2018, xarray was funded by NumFOCUS. Xarray was designed specifically for multi-dimensional arrays and datasets. The library integrates different functions including reading netCDF files, processing data, selecting and slicing datasets, statistical computation, and plotting. The integration of different functions into a single package greatly simplifies the workflow.
Therefore, this tutorial will follow three steps: reading files, data analysis, and visualization. Using the xarray library as the core for data processing, statistical computation, and plotting, it introduces commonly used Python libraries and programming techniques from the perspective of climate analysis to establish a data analysis workflow. The purpose of this tutorial is not to establish a detailed guide on xarray, but to introduce the applications of xarray in climate studies based on real-world examples. To find the details on a certain function or module, please refer to the API on the xarray official website.
Import Python Libraries#
To start a new Python code, it is required to import libraries. To do so, just add the following lines to an empty Python script (example.py). For instance,
import numpy as np
import xarray as xr
from matplotlib import pyplot as plt

