6. Climatology and Anomaly#
To start climate analysis, we often begin by analyzing climatology and anomaly.
Calculate Monthly Climatology and Anomaly with groupby#
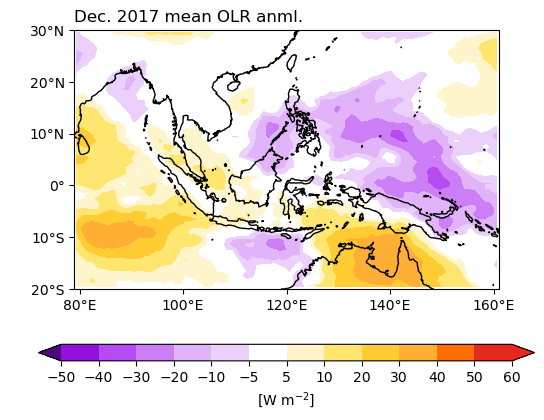
We first open the OLR file. In the following example, climatology is calculated from 1998 to 2016, and the near real-time period is 2017. The anomaly is defined as the data from 2017 subtracting the climatology.
import numpy as np
import pandas as pd
import xarray as xr
from cartopy import crs as ccrs
from cartopy.mpl.gridliner import LONGITUDE_FORMATTER, LATITUDE_FORMATTER
import matplotlib as mpl
from matplotlib import pyplot as plt
import cmaps

mpl.rcParams['figure.dpi'] = 100

# Spatial and temporal range parameters
lats = -20
latn =  30
lon1 =  79
lon2 = 161
time1 = '2017-12-01'
time2 = '2017-12-31'

# Open file
olr_ds = xr.open_dataset("data/olr.nc")
# Long term data to calculate climatology
olr = (olr_ds.sel(time=slice('1998-01-01','2016-12-31'),
                    lat=slice(lats,latn),
                    lon=slice(lon1,lon2)).olr)
# Real time period for anomaly.
olrrt = (olr_ds.sel(time=slice('2017-12-01','2017-12-31'),
                    lat=slice(lats,latn),
                    lon=slice(lon1,lon2)).olr)
In Unit 4, we learned how to conditionally control datetime objects using xarray. Similarly, we group and calculate the mean of dates within the same month based on the datetime accessor time.month to obtain the monthly climatology. To group by the same months, we use the xarray function groupby.
olrGB = olr.groupby("time.month")
olrMonClim = olrGB.mean("time")  # The `mean` here is to mean over the same group, not mean over the entire period.
olrMonClim
<xarray.DataArray 'olr' (month: 12, lat: 50, lon: 82)> Size: 197kB
array([[[270.46295, 270.7331 , 270.65665, ..., 257.25116, 256.66913,
         255.8849 ],
        [269.24954, 268.8672 , 269.106  , ..., 253.44592, 253.16605,
         252.61195],
        [267.06573, 267.1016 , 267.57956, ..., 249.2561 , 248.4184 ,
         247.00943],
        ...,
        [257.9647 , 257.92267, 258.25693, ..., 256.99445, 256.7958 ,
         257.13882],
        [253.88762, 253.44121, 252.49251, ..., 252.6739 , 252.67776,
         252.66586],
        [245.34576, 240.01846, 228.33456, ..., 248.65149, 248.66846,
         248.49452]],

       [[266.90402, 267.24286, 267.5611 , ..., 255.47617, 254.07542,
         253.1878 ],
        [264.35098, 264.73938, 264.88358, ..., 251.78018, 251.39395,
         251.59006],
        [261.4748 , 262.03244, 262.23868, ..., 247.40343, 248.10786,
         248.63504],
...
        [281.75525, 281.88843, 282.38974, ..., 263.41364, 263.98563,
         264.83344],
        [279.72992, 279.606  , 276.21066, ..., 257.44904, 258.60928,
         259.01102],
        [270.86935, 264.80884, 252.71701, ..., 252.37296, 253.24255,
         254.25143]],

       [[277.68835, 277.9624 , 278.4138 , ..., 268.97833, 268.33752,
         267.38034],
        [276.88388, 276.72455, 277.11646, ..., 267.85056, 267.2011 ,
         266.11264],
        [274.72495, 274.7343 , 275.10522, ..., 266.41324, 264.9135 ,
         264.2871 ],
        ...,
        [269.02094, 269.55533, 270.47006, ..., 258.97546, 259.5016 ,
         260.03702],
        [266.66284, 267.08347, 265.3553 , ..., 253.46599, 253.83997,
         254.14189],
        [258.7794 , 254.24704, 243.16266, ..., 248.40625, 248.42702,
         248.41464]]], dtype=float32)
Coordinates:
  * lon      (lon) float32 328B 79.5 80.5 81.5 82.5 ... 157.5 158.5 159.5 160.5
  * lat      (lat) float32 200B -19.5 -18.5 -17.5 -16.5 ... 26.5 27.5 28.5 29.5
  * month    (month) int64 96B 1 2 3 4 5 6 7 8 9 10 11 12
Attributes:
    standard_name:  toa_outgoing_longwave_flux
    long_name:      NOAA Climate Data Record of Daily Mean Upward Longwave Fl...
    units:          W m-2
cell_methods: time: mean area: meanSimilarly, anomalies are obtained by grouping the real-time data using groupby and then subtracting the climatology. The groupby function identifies corresponding month groups.
olra = olrrt.groupby('time.month').mean('time') - olrMonClim
olra
<xarray.DataArray 'olr' (month: 1, lat: 50, lon: 82)> Size: 16kB
array([[[ 9.78244   ,  9.909546  ,  8.493408  , ...,  2.497589  ,
          1.3457642 , -0.74990845],
        [ 8.7960205 ,  9.101654  ,  9.233459  , ...,  0.71640015,
         -0.6616211 , -2.1523438 ],
        [ 7.6419373 ,  9.022461  , 10.015717  , ...,  1.4698181 ,
         -0.83166504, -3.696045  ],
        ...,
        [-6.5422363 , -5.305298  , -6.9757385 , ..., 10.722809  ,
         12.269043  , 13.60672   ],
        [-5.522644  , -5.3371887 , -5.0463257 , ...,  7.494705  ,
          8.715515  ,  9.534042  ],
        [-5.712723  , -4.664627  , -4.2814484 , ...,  4.3125763 ,
          5.6015167 ,  6.7983246 ]]], dtype=float32)
Coordinates:
  * lon      (lon) float32 328B 79.5 80.5 81.5 82.5 ... 157.5 158.5 159.5 160.5
  * lat      (lat) float32 200B -19.5 -18.5 -17.5 -16.5 ... 26.5 27.5 28.5 29.5
* month (month) int64 8B 12We plot the anomaly field.
from matplotlib import pyplot as plt
from cartopy import crs as ccrs
from cartopy.mpl.gridliner import LONGITUDE_FORMATTER, LATITUDE_FORMATTER
import cmaps

proj = ccrs.PlateCarree()
fig,ax = plt.subplots(1,1,subplot_kw={'projection':proj})
clevs = [-50,-40,-30,-20,-10,-5,5,10,20,30,40,50,60]
olrPlot = (olra[0,:,:]
               .plot.contourf("lon", "lat",
                              transform=proj,
                              ax=ax,
                              levels=clevs,
                              cmap=cmaps.sunshine_diff_12lev,
                              add_colorbar=True,
                              extend='both',
                              cbar_kwargs={'orientation': 'horizontal', 'aspect': 30, 'label': r'[W m$^{-2}$]', 'ticks':clevs})
                              )

ax.set_extent([lon1,lon2,lats,latn],crs=proj)
ax.set_xticks(np.arange(80,180,20), crs=proj)
ax.set_yticks(np.arange(-20,40,10), crs=proj)
lon_formatter = LONGITUDE_FORMATTER
lat_formatter = LATITUDE_FORMATTER
ax.xaxis.set_major_formatter(lon_formatter)
ax.yaxis.set_major_formatter(lat_formatter)
ax.coastlines()
ax.set_ylabel(' ')
ax.set_xlabel(' ')
plt.title(' ')
plt.title("Dec. 2017 mean OLR anml.", loc='left')
plt.show()

Calculate daily climatology and anomaly#
Similar to monthly climatology, we can group the data by time.dayofyear to calculate daily climatology.
olrGB = olr.groupby("time.dayofyear")
olrDayClim = olrGB.mean("time")

olra = olrrt.groupby('time.dayofyear') - olrDayClim

olra
<xarray.DataArray 'olr' (time: 31, lat: 50, lon: 82)> Size: 508kB
array([[[ 15.12207   ,  16.334747  ,  13.599518  , ..., -60.50157   ,
         -79.519516  , -72.87891   ],
        [ 21.117798  ,  19.827057  ,  18.036957  , ..., -60.637573  ,
         -67.54947   , -56.39473   ],
        [ 23.31018   ,  22.088043  ,  21.162445  , ..., -54.980957  ,
         -57.3517    , -61.343445  ],
        ...,
        [ 16.104095  ,  17.379211  ,  15.227692  , ...,  19.058533  ,
          20.518616  ,  17.546478  ],
        [ 10.698151  ,   9.565765  ,   9.262054  , ...,  15.9817505 ,
          16.922516  ,  15.873199  ],
        [  9.011993  ,  10.094391  ,   7.4619446 , ...,  25.991821  ,
          22.395844  ,  24.516144  ]],

       [[ 10.832886  ,  11.870026  ,  11.048401  , ...,   7.759735  ,
           3.9926758 , -11.958023  ],
        [ 18.722748  ,  18.02127   ,  16.30835   , ...,  18.752747  ,
          -9.488678  , -19.771454  ],
        [ 29.749542  ,  28.71933   ,  23.702057  , ...,  26.725952  ,
          -5.3364563 , -18.360504  ],
...
        [ 20.139404  ,  17.60962   ,  10.017792  , ...,   1.2883606 ,
          -2.57518   , -10.758987  ],
        [ 23.506134  ,  20.85086   ,  14.741516  , ...,  -2.9874268 ,
          -4.8914337 ,  -7.4083557 ],
        [ 22.266754  ,  16.122162  ,  13.668915  , ...,   2.6325684 ,
          -4.155838  ,  -3.7362213 ]],

       [[ 17.165863  ,  26.317688  ,  26.874603  , ...,  -6.7277527 ,
           8.582062  ,   5.428833  ],
        [ 24.211151  ,  29.262115  ,  28.295593  , ...,  -4.6532288 ,
          11.954285  ,  14.010925  ],
        [ 26.614563  ,  29.692871  ,  28.318512  , ...,   7.863983  ,
          19.585358  ,  25.504883  ],
        ...,
        [ 18.78122   ,  14.21608   ,  10.089493  , ...,  12.241455  ,
          12.811493  ,  19.498688  ],
        [ 19.80365   ,  17.64177   ,   8.04245   , ...,  13.380524  ,
          18.125275  ,  19.97647   ],
        [ 16.37706   ,  11.906448  ,   9.840515  , ...,  12.811996  ,
          11.387054  ,  10.2677765 ]]], dtype=float32)
Coordinates:
  * time       (time) datetime64[ns] 248B 2017-12-01 2017-12-02 ... 2017-12-31
  * lon        (lon) float32 328B 79.5 80.5 81.5 82.5 ... 158.5 159.5 160.5
  * lat        (lat) float32 200B -19.5 -18.5 -17.5 -16.5 ... 27.5 28.5 29.5
dayofyear (time) int64 248B 335 336 337 338 339 340 ... 361 362 363 364 365Calculate “Smooth” Annual Cycle#
The smooth annual cycle is calculated to preserve the first n harmonic cycles using the Fast Fourier Transform (FFT) method. To perform FFT, we need to use the scipy library. Below is a function adapted from NCAR Command Language (NCL) to calculate the smooth annual cycle. The function requires the unsmoothed annual cycle (clmDay=olrDayClim from the above example) and the number of harmonic cycles nHarm.
from scipy.fft import rfft, irfft

def smthClmDay(clmDay, nHarm):
    nt, ny, nx = clmDay.shape
    cf = rfft(clmDay.values, axis=0)     # xarray.DataArray.values: convert to numpy.ndarray first.
    cf[nHarm,:,:] = 0.5*cf[nHarm,:,:]    # mini-taper.
    cf[nHarm+1:,:,:] = 0.0               # set all higher coef to 0.0
    icf = irfft(cf, n=nt, axis=0)       # reconstructed series
    clmDaySmth = clmDay.copy(data=icf, deep=False)
    return(clmDaySmth)

olrDayClim_sm = smthClmDay(olrDayClim, 3)
olrDayClim_sm
<xarray.DataArray 'olr' (dayofyear: 366, lat: 50, lon: 82)> Size: 6MB
array([[[273.80515, 274.10938, 274.2879 , ..., 261.79456, 260.94968,
         259.96237],
        [272.50842, 272.31113, 272.69553, ..., 259.65186, 259.05933,
         258.1859 ],
        [270.22046, 270.31717, 270.83304, ..., 256.96295, 255.90952,
         254.99857],
        ...,
        [260.15997, 260.5604 , 261.29028, ..., 257.65775, 257.77252,
         258.23932],
        [256.91174, 257.18835, 256.1388 , ..., 252.47044, 252.64952,
         252.72316],
        [249.13116, 244.76389, 233.80005, ..., 247.78957, 247.84799,
         247.76077]],

       [[273.66   , 273.9643 , 274.14062, ..., 261.4893 , 260.6607 ,
         259.6891 ],
        [272.35568, 272.1524 , 272.53165, ..., 259.30478, 258.74103,
         257.90274],
        [270.05838, 270.1501 , 270.6593 , ..., 256.57834, 255.56288,
         254.67546],
...
        [260.96295, 261.39435, 262.1524 , ..., 257.77435, 257.91217,
         258.39255],
        [257.7688 , 258.06982, 256.98972, ..., 252.51714, 252.7237 ,
         252.81175],
        [249.98839, 245.6104 , 234.62175, ..., 247.77896, 247.85405,
         247.79375]],

       [[273.94824, 274.25226, 274.4333 , ..., 262.10028, 261.23892,
         260.23553],
        [272.6587 , 272.46793, 272.85754, ..., 259.9982 , 259.37653,
         258.46805],
        [270.37982, 270.48196, 271.00443, ..., 257.34586, 256.2545 ,
         255.32027],
        ...,
        [260.5534 , 260.96948, 261.71365, ..., 257.7139 , 257.8402 ,
         258.31378],
        [257.33246, 257.6214 , 256.55753, ..., 252.49162, 252.68434,
         252.76512],
        [249.55336, 245.18178, 234.20656, ..., 247.78217, 247.84875,
         247.77481]]], dtype=float32)
Coordinates:
  * lon        (lon) float32 328B 79.5 80.5 81.5 82.5 ... 158.5 159.5 160.5
  * lat        (lat) float32 200B -19.5 -18.5 -17.5 -16.5 ... 27.5 28.5 29.5
  * dayofyear  (dayofyear) int64 3kB 1 2 3 4 5 6 7 ... 361 362 363 364 365 366
Attributes:
    standard_name:  toa_outgoing_longwave_flux
    long_name:      NOAA Climate Data Record of Daily Mean Upward Longwave Fl...
    units:          W m-2
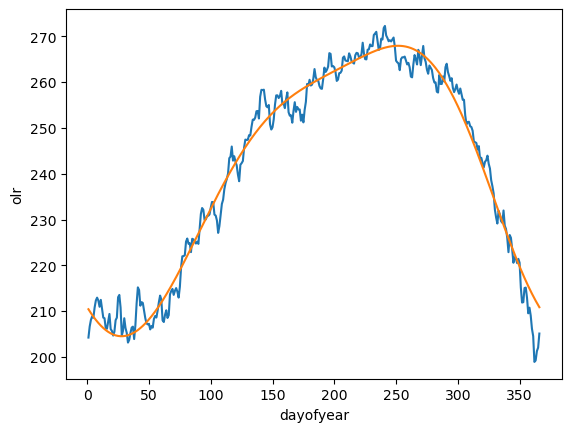
cell_methods: time: mean area: meanWe compare the smoothed and unsmoothed climatology time series over the Australia monsoon region (115˚-150˚E, 2˚-15˚S).
plt.figure()
lp = (olrDayClim.sel(lon=slice(115,150),lat=slice(-15,-2))
                .mean(["lat","lon"])
                .plot.line(x="dayofyear"))
lp_sm = (olrDayClim_sm.sel(lon=slice(115,150),lat=slice(-15,-2))
                      .mean(["lat","lon"])
                      .plot.line(x="dayofyear"))
plt.show()

The x-axis is the day of year and the y-axis is the OLR values. The blue curve is the unsmoothed annual cycle, and the orange curve is the smoothed annual cycle by preserving the first three harmonics.
